Financial guidance that's designed forReal life

We help employees live well today while preparing for retirement.

Flexible strategies for today, tomorrow, and beyond


Inspire employees on their path to financial wellness with this all-in-one app. BeFine offers a holistic view of their finances, smart tips, and friendly guidance that can help them make real progress.
Explore the app ›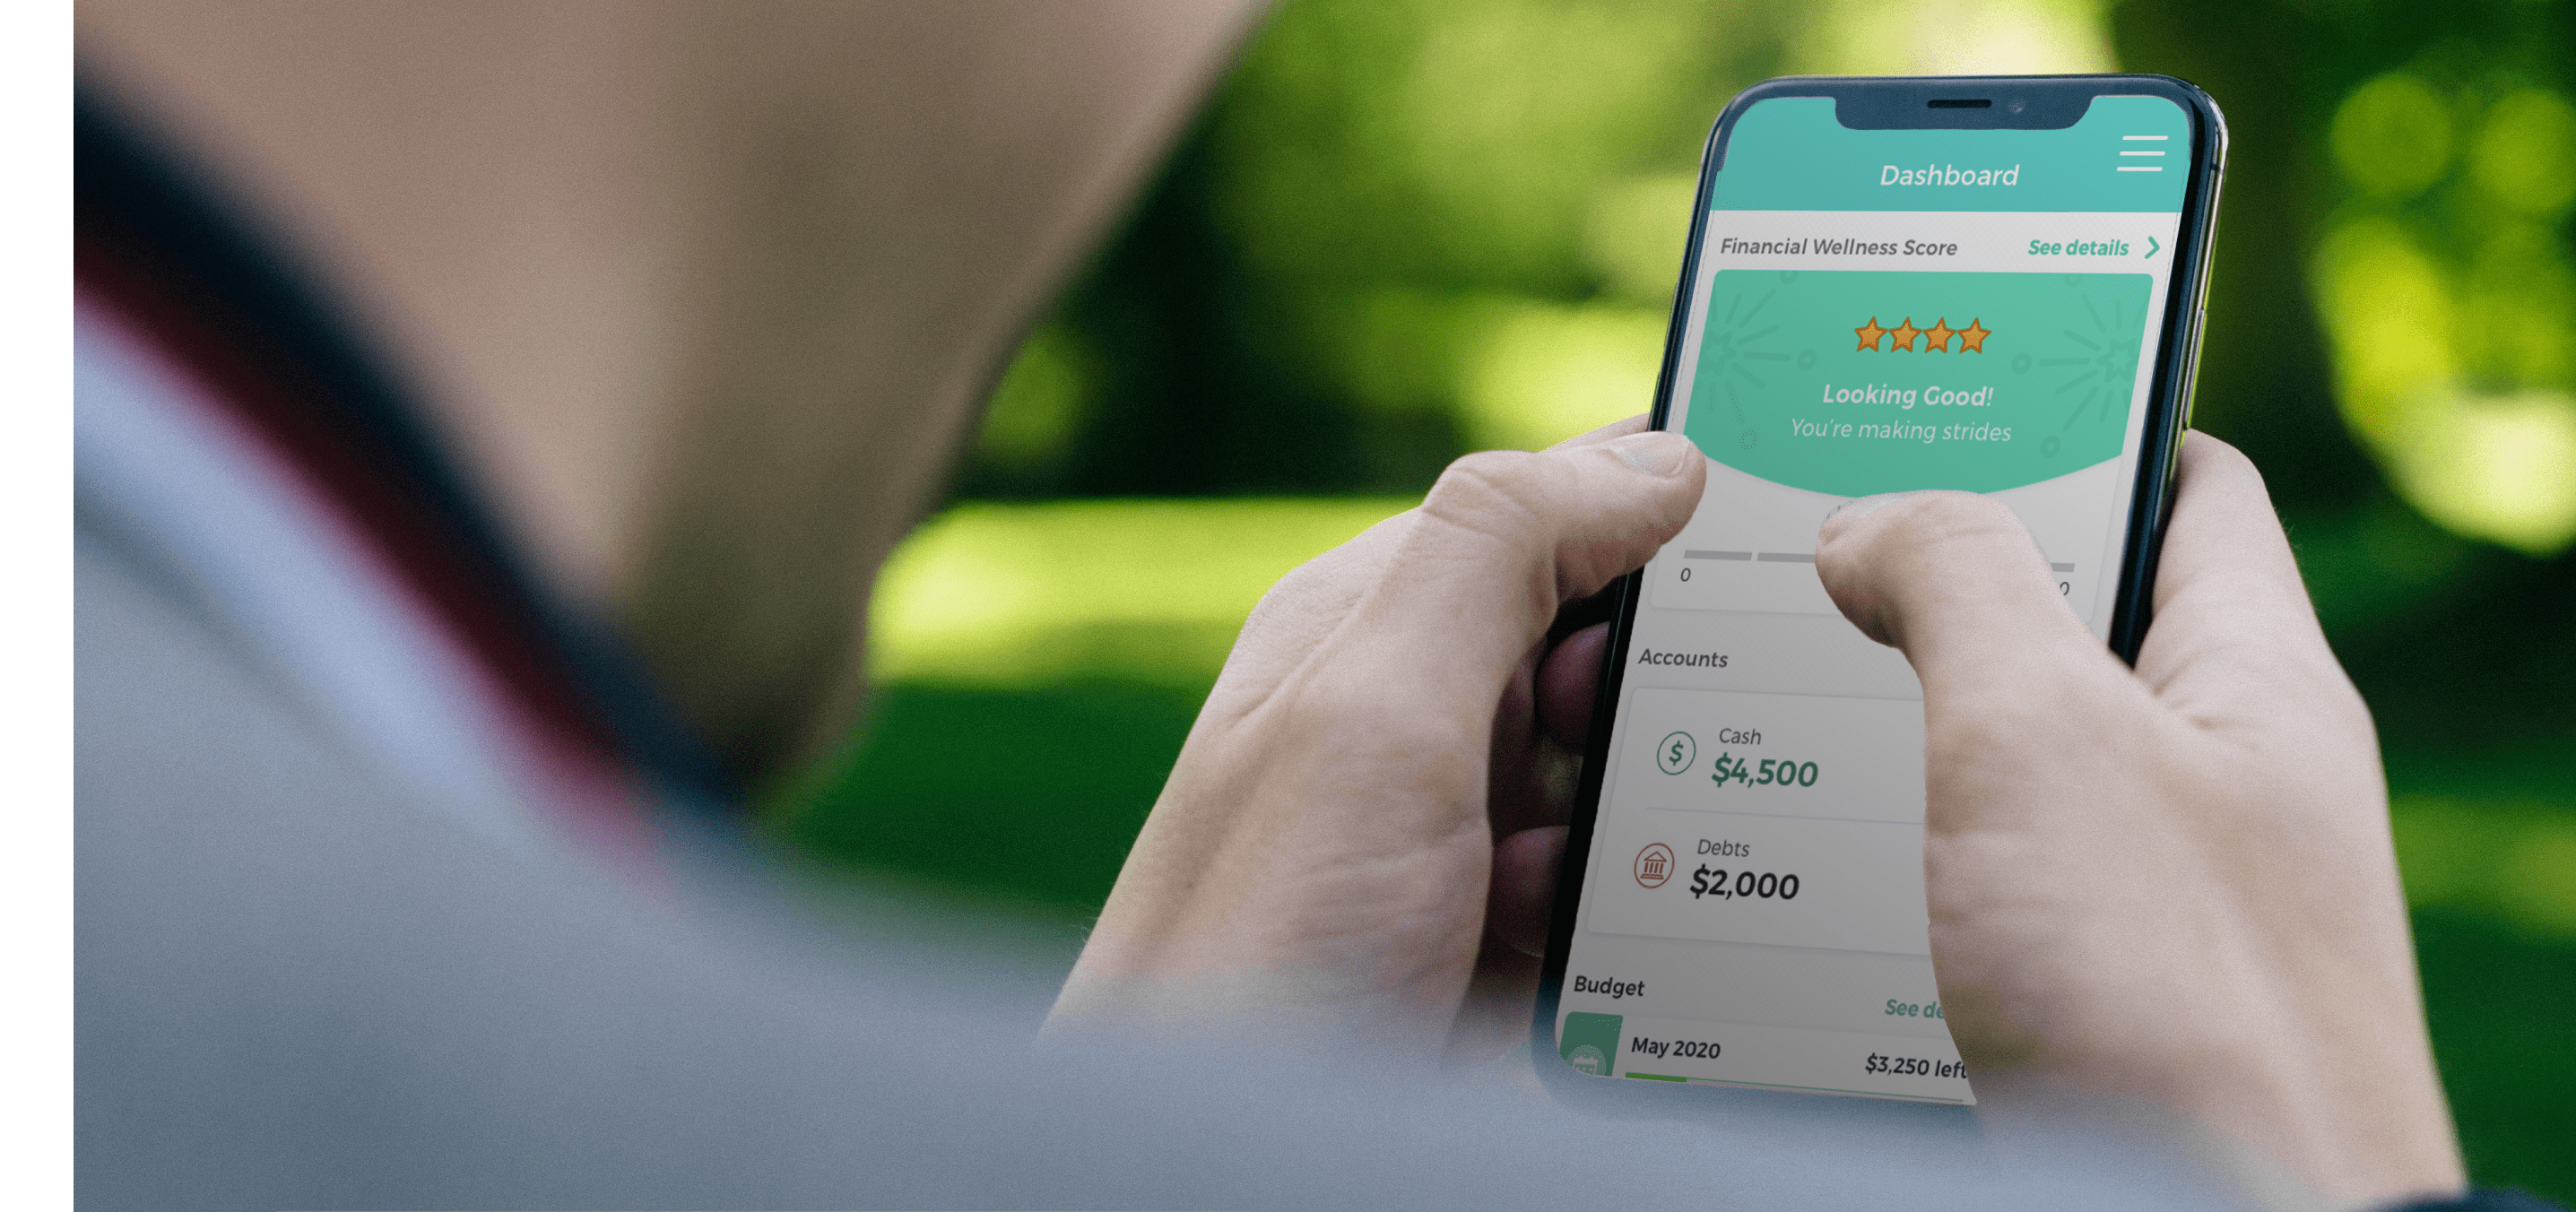
Make saving for retirement as effortless as possible with our managed account solution. Virtually hands-off for employees, our managed accounts flex to their changing financial situations.
Explore the PROgram ›
Give employees the tools to see how choices they make now could affect their plans for the future. From modeling savings rates to mapping out spending during retirement, Vision can help them prepare for their financial future.
Explore Vision ›
Understand what’s working—and what isn’t—in your retirement benefit plans. Insight lets employers see how their retirement plans are being used and can help them spot areas to improve their retirement benefit package.
Explore Insight ›
Have questions? We have answers.
Interested in learning more?